by Pat Stanton
Throughout the 19th and 20th centuries, conventional wisdom equated economic growth with a rise in energy use, across the board. An examination of trends over the past three decades, proves that the correlation is no longer valid.
A Synapse Energy Economics analysis of data from the Energy Information Agency (EIA) recently commissioned by E4TheFuture compares per capita economic growth, energy use and CO2 emissions nationally, and for each state and the District of Columbia.
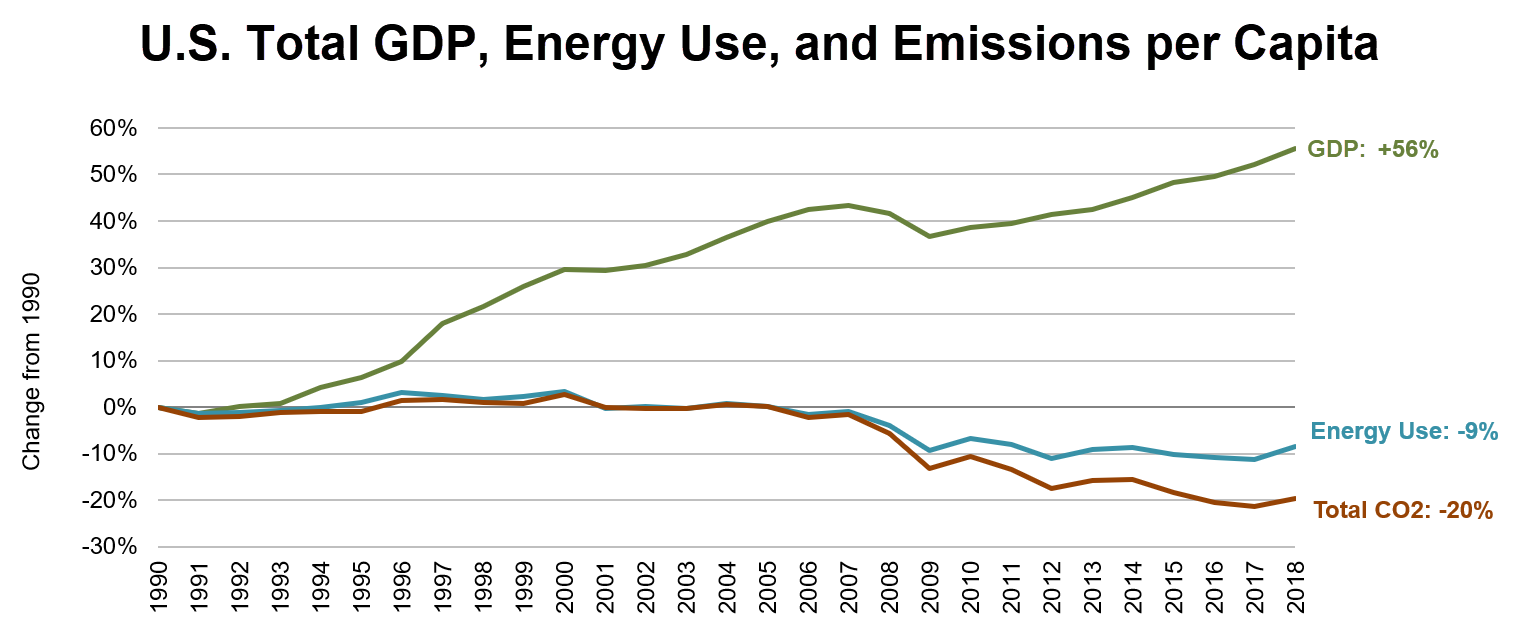
Per capita US Gross Domestic Product (GDP) grew more than 56% from 1990 to 2018 while per capita energy use actually fell by 9%. Even more encouraging, over the same time period the energy we used became much cleaner: CO2 emissions per capita fell by 20%. See a Synapse Memo with background about their analysis.
Today, E4TheFuture is launching an update to our state-level data resource. Users can easily navigate to see similar graphs for every state and the District of Columbia. In every state — whether an energy exporter or importer — energy use per capita grew at a slower rate than the Gross State Product (GSP). In 47 out of 51 states, per capita emissions trended down more rapidly than per capita energy use from 1990-2018. States are using less energy, and our energy sources are getting cleaner.
Let’s look at a few specific examples.
Different States, Same Overall Trends
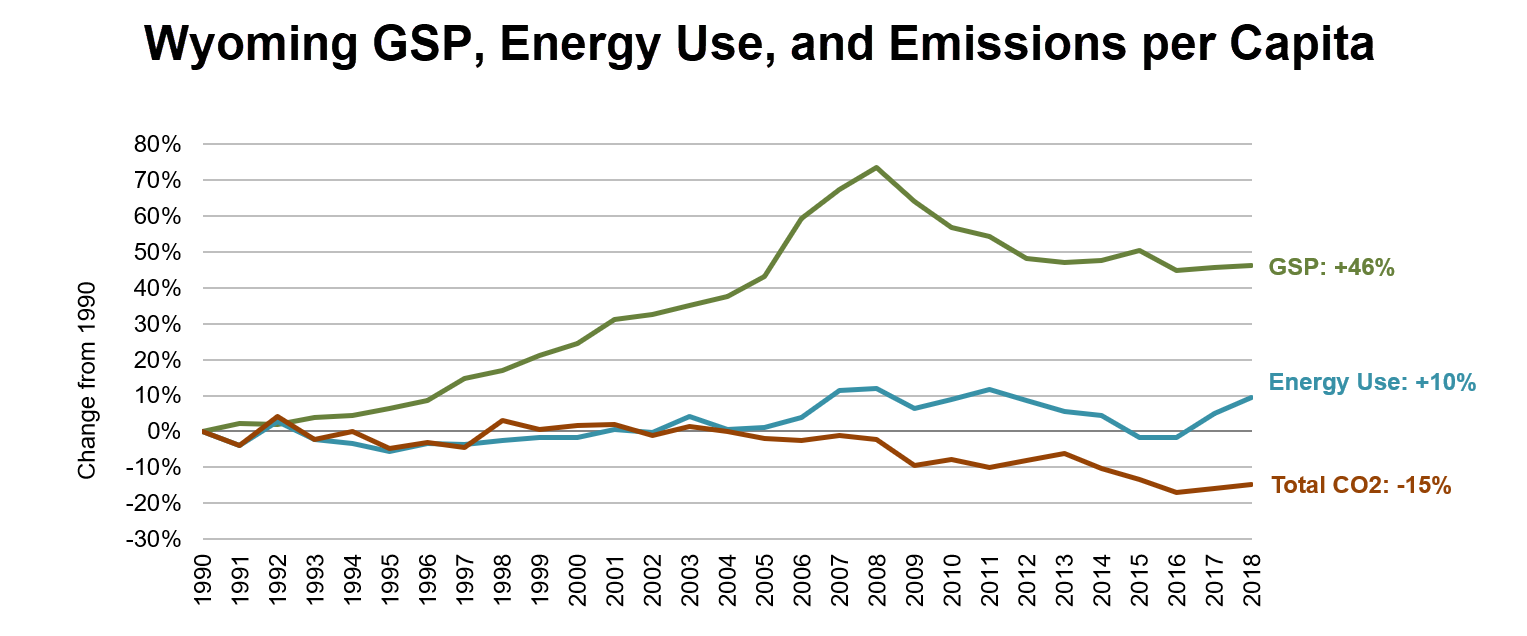
In Wyoming, GSP increased at a much higher rate than energy use over the past three decades. The state leads the nation in coal production and is third in total national energy production. Wyoming exports 35% of electricity produced in-state and is ranked second in the nation for the largest percentage of electricity exports. Although Wyoming is a leading U.S. producer of fossil fuels, carbon emissions in the state decreased by 15% since 1990, showing that the trend of increased GSP and decreased emissions applies even in major fossil fuel producing states.
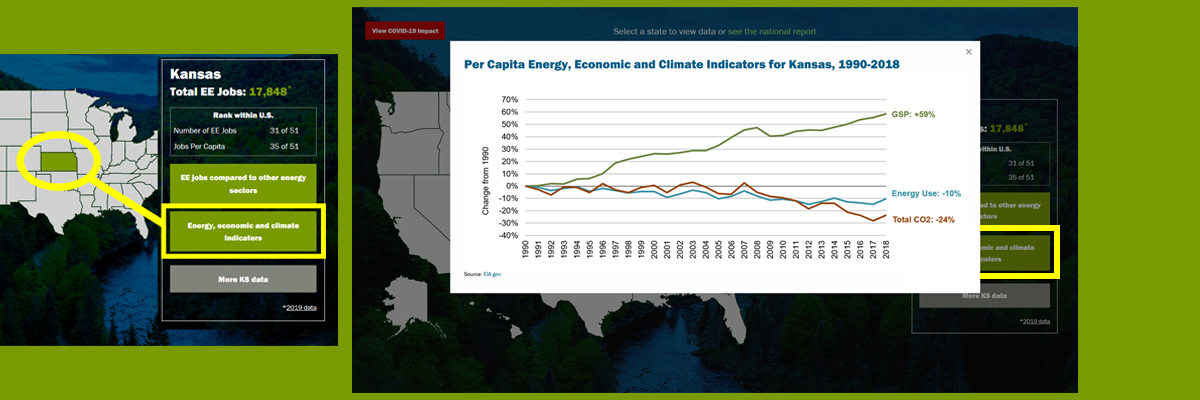
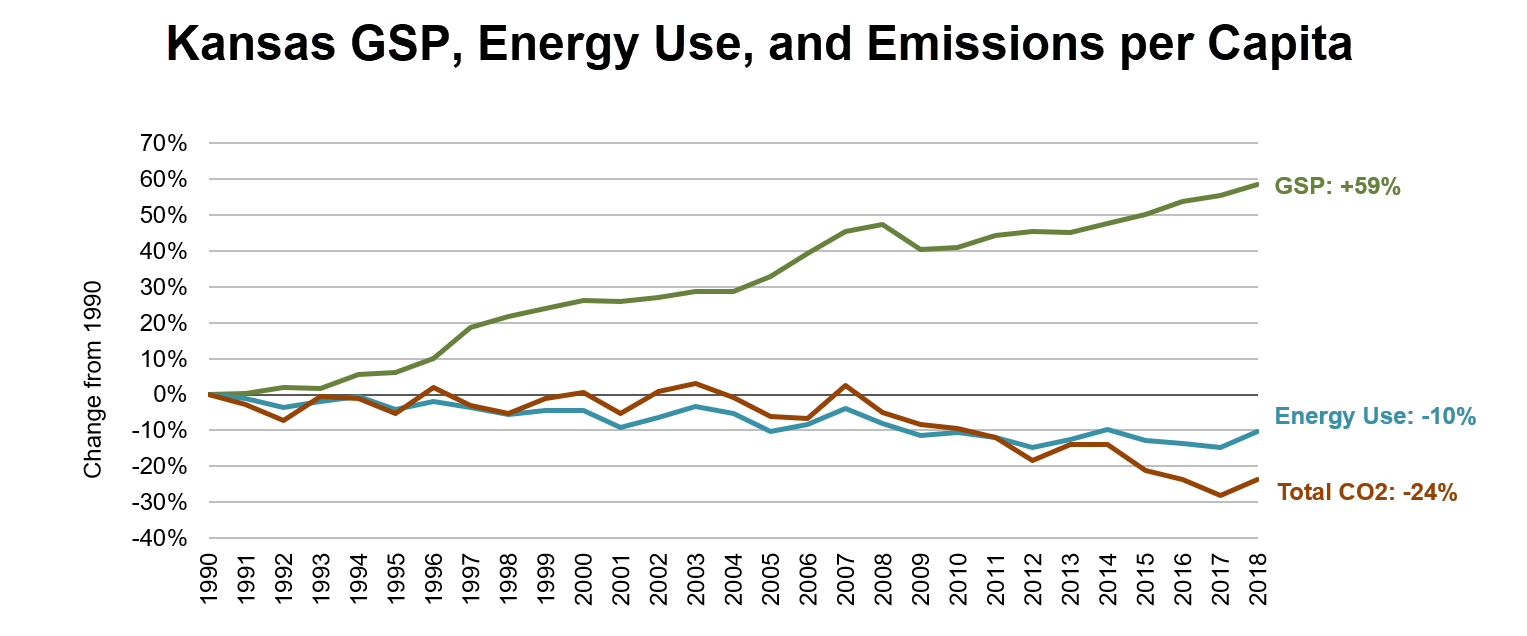
Next, we turn to Kansas where the economy grew significantly while per capita energy use and emissions decreased. Per capita emissions fell more rapidly than energy use, particularly in the last five years. As of 2019, Kansas was one of the top five states in the nation for wind energy generation. The state’s geography will continue to make it an ideal location for wind power generation. Like Wyoming, Kansas is a net exporter of energy, but of wind energy rather than fossil fuels. Wyoming may also soon become a wind-generated energy exporter: Several large wind projects are under development or in construction.
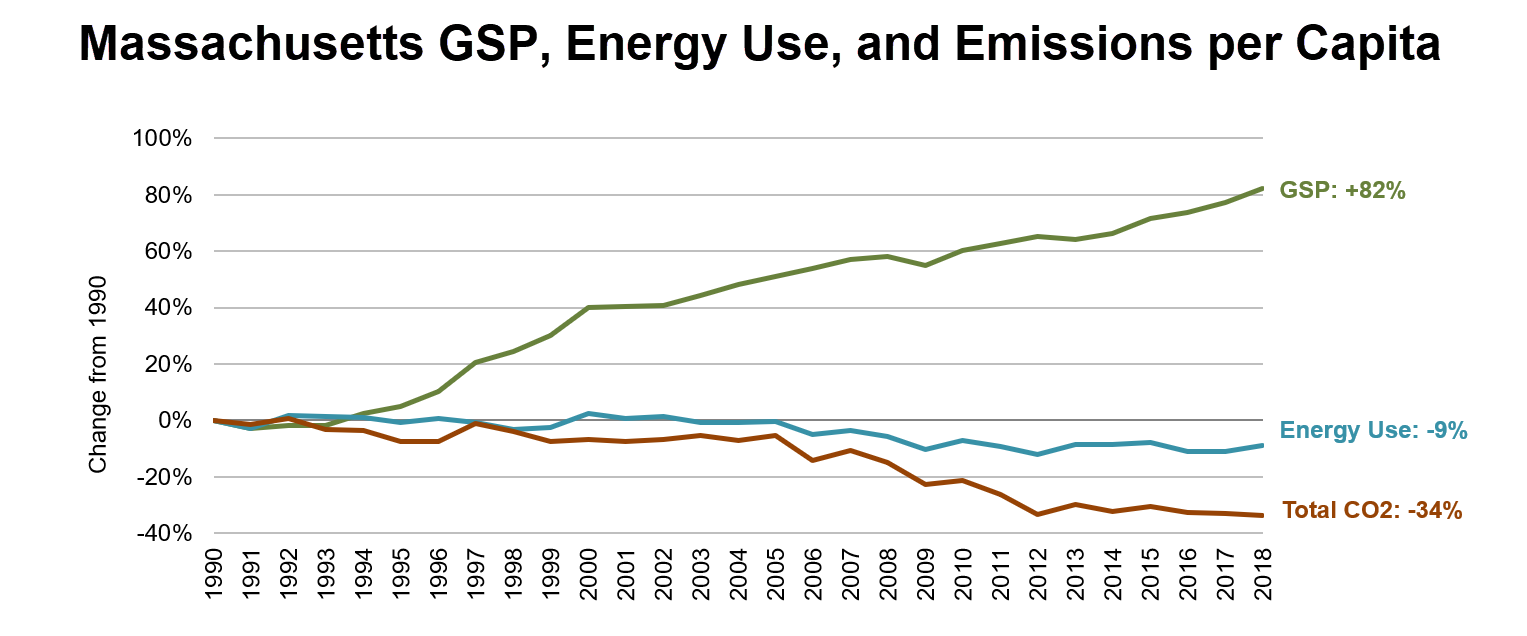
I couldn’t resist bringing my home state — a more urban, service-economy — into this comparison. What does Massachusetts tell us? A state that imports virtually all of its energy from national and international markets, by going all-in on energy efficiency and renewable resource investments has an even greater divergence among increases in per capita GSP, energy use and CO2 emissions. By December 2019, Massachusetts was eighth in the nation for solar generation and a national leader in energy efficiency investments.
Looking Ahead
Regardless of whether states are large or small, urban or rural, energy importers or energy exporters, per capita GSP is growing more quickly than per capita energy use. It is clear that the trend of energy use and emissions decreasing relative to GSP is not a blip. It is likely to accelerate, across the nation.
And I expect states to continue to capitalize on the opportunity to use cleaner energy, and use energy more efficiently, while strengthening economies. As Bob Keefe of E2 said on the Impact Podcast “The economy and the environment are not at odds. They do not have to be at odds. And in fact, they rely on one another. We cannot have a good, strong economy without a good environment.” I couldn’t agree more.
I invite you to view the evolution of your state and those in your region. The graphs are among many resources you will find, including state level information on energy efficiency jobs and COVID-19 impacts.
Please join us in sharing these resources and spreading the word about the economic benefits of cleaner, more efficient energy in your home state. Contact policy@e4thefuture.org with any questions.
–Pat Stanton is E4TheFuture’s Director of Policy